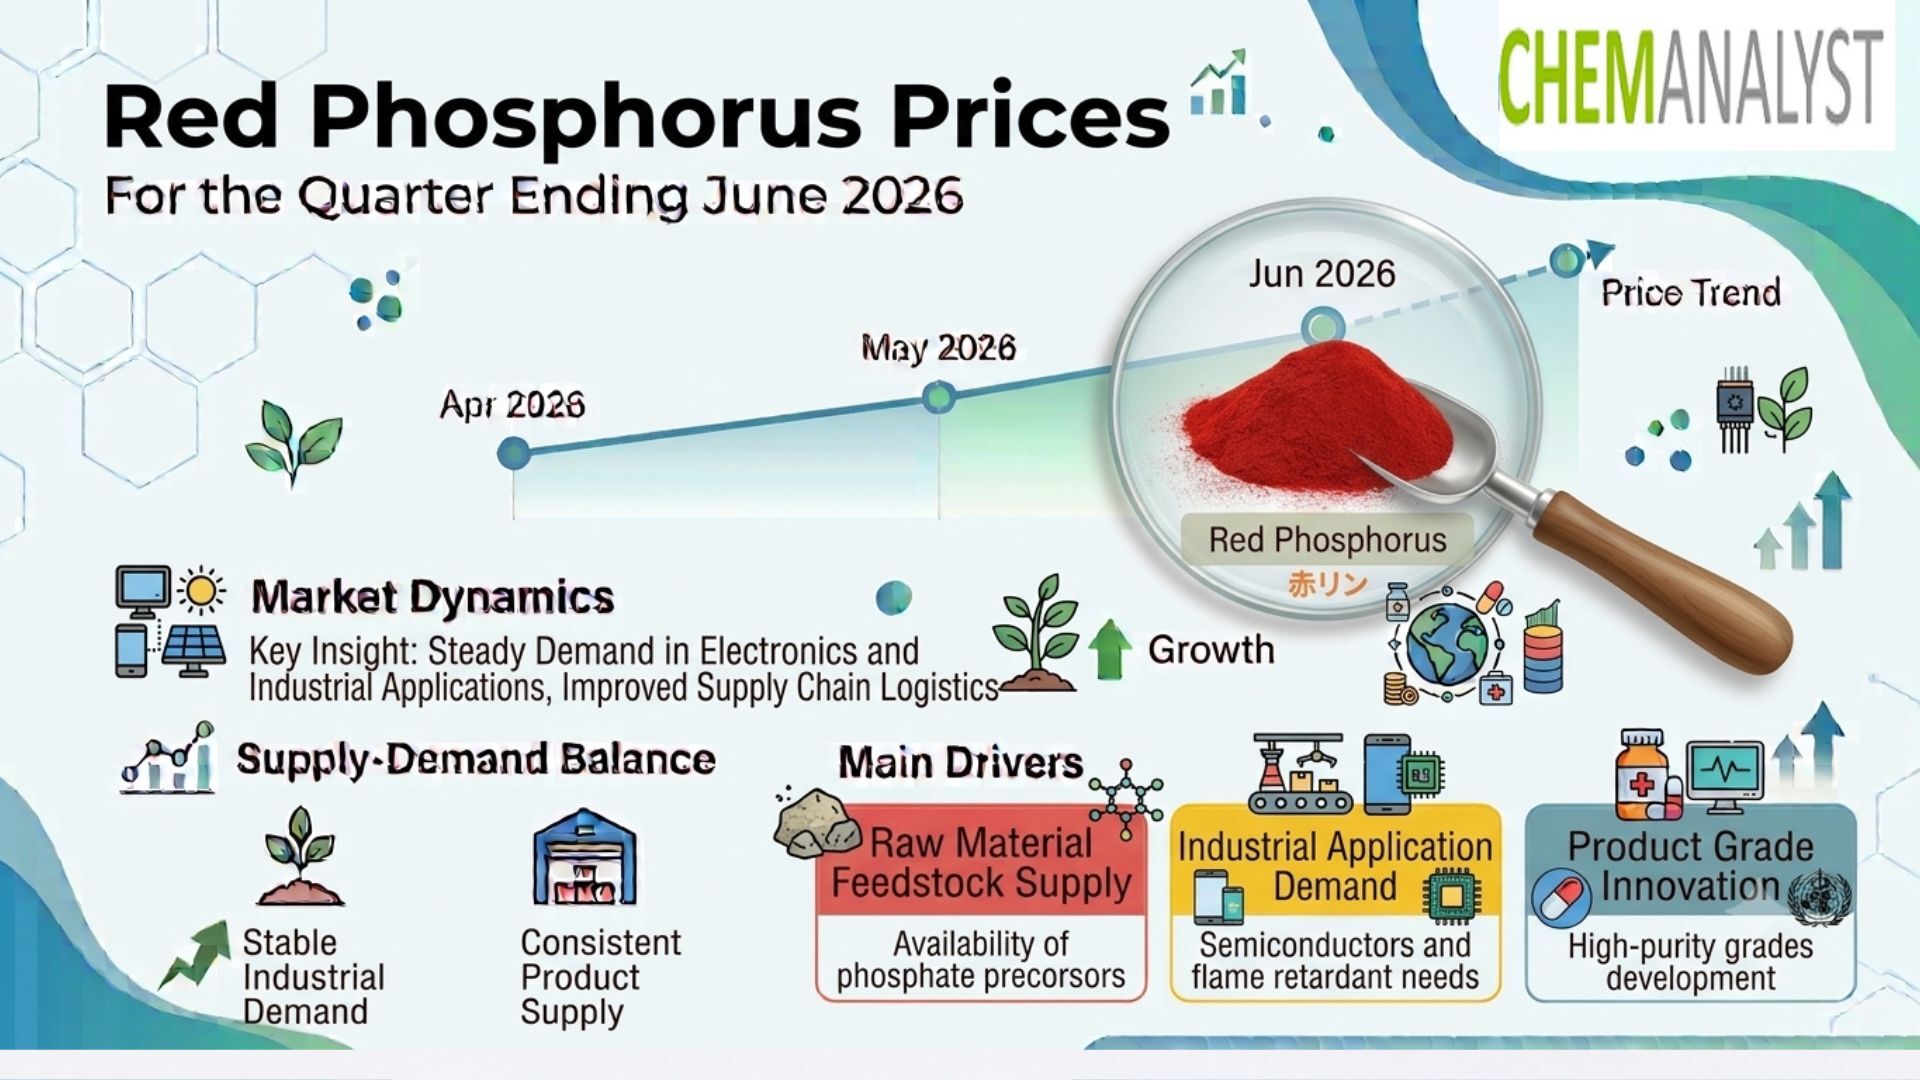
According to ChemAnalyst, the Red Phosphorus Prices market recorded an upward trend across key global regions during the second quarter of 2026. Markets in Asia-Pacific (APAC), North America and Europe experienced quarter-over-quarter increases in their respective Red Phosphorus Price Indexes, with production costs emerging as a common factor behind the firmer pricing environment.
Red Phosphorus is an important industrial material used across several applications, including flame-retardant systems, specialty chemical manufacturing, phosphorus-based compounds and other industrial processes. Because its production is energy-intensive and closely linked with industrial operating costs, changes in electricity prices, producer prices and broader manufacturing expenses can significantly influence market pricing.
During Q2 2026, China, the United States and Germany all recorded increases in their Red Phosphorus Price Index. However, the factors behind the increases varied by region. China's market was primarily influenced by increasing production costs, while the United States faced higher producer prices and rising industrial electricity costs. Germany's market was similarly affected by increasing production costs and higher producer prices.
Red Phosphorus Prices in APAC
China Red Phosphorus Price Trends
China remained an important market for Red Phosphorus during Q2 2026. The Red Phosphorus Price Index rose quarter-over-quarter in Q2 2026, driven by increasing production costs.
The upward movement in the Chinese market reflected a higher cost environment for producers. When manufacturing expenses increase, suppliers typically reassess their selling prices to protect operating margins and maintain sustainable production economics.
For Red Phosphorus, production costs are particularly important because the manufacturing process requires significant industrial resources. Changes in energy expenses, raw material costs, labor, utilities and other operating inputs can influence the final market price.
During Q2 2026, the increase in production costs therefore created upward pressure on Red Phosphorus Prices in China. The market remained firm as producers operated against a comparatively higher cost base.
China Red Phosphorus Price Assessment
The average Red Phosphorus price for the quarter was approximately USD 5620/MT FOB China.
This price assessment provides an important benchmark for understanding the Chinese Red Phosphorus market during Q2 2026. The FOB China basis is particularly relevant for international buyers evaluating procurement costs from Chinese suppliers, as it provides a reference for the product price before additional freight and destination-related expenses.
The quarterly average also demonstrates the impact of increasing production costs on market pricing. For buyers, monitoring both the quoted market price and the underlying production-cost environment can provide better insight into potential future movements.
Impact of Production Costs on Chinese Prices
Increasing production costs remained the principal factor behind the quarter-over-quarter increase in China's Red Phosphorus Price Index.
When costs rise throughout the manufacturing chain, producers may attempt to transfer some of the additional expenses to customers. The extent of cost pass-through depends on supply conditions, demand, competition, inventory levels and producers' ability to absorb higher expenses.
In Q2 2026, the upward movement in the Red Phosphorus Price Index indicated that cost pressures were sufficiently significant to influence market assessments.
Get Real Time Online for Red Phosphorus Prices: https://www.chemanalyst.com/Pricing-data/red-phosphorus-2416
Red Phosphorus Prices in North America
United States Red Phosphorus Price Trends
In the United States, the Red Phosphorus Price Index rose quarter-over-quarter in Q2 2026, influenced by a 5.5% PPI increase in June 2026.
The U.S. market therefore experienced a notable increase in producer-price pressure during the quarter. A higher Producer Price Index generally indicates increasing costs at the producer level, which can influence the economics of industrial manufacturing and chemical production.
For Red Phosphorus producers, higher industrial costs can result in increased manufacturing expenses. Producers may subsequently adjust selling prices to compensate for higher operating costs and preserve margins.
The 5.5% PPI increase in June 2026 consequently represented an important market indicator for the U.S. Red Phosphorus sector and contributed to the quarter-over-quarter increase in the Red Phosphorus Price Index.
Rising U.S. Industrial Electricity Prices
Red Phosphorus production costs increased in Q2 2026, driven by rising U.S. industrial electricity prices as of April 2026.
Electricity is an important consideration for industrial manufacturing because energy-intensive processes can be highly sensitive to changes in power costs. When industrial electricity prices rise, producers may face higher operating expenses even when other production inputs remain stable.
For Red Phosphorus manufacturers, rising electricity costs can therefore create direct pressure on production economics. If higher energy expenses persist, producers may need to incorporate these costs into their selling prices.
The combination of rising industrial electricity prices and the 5.5% PPI increase in June 2026 created a supportive environment for higher Red Phosphorus Prices in the United States.
Energy Costs and Red Phosphorus Market Economics
Energy prices can play a significant role in determining the competitiveness of industrial chemical production. Higher electricity costs can increase the expense associated with manufacturing, processing and operating production facilities.
In the U.S. market during Q2 2026, rising industrial electricity prices became an additional cost-side factor alongside broader producer-price inflation.
This illustrates why buyers tracking Red Phosphorus Prices should monitor not only chemical-specific supply and demand but also major industrial cost indicators. Energy-market developments can provide an early indication of potential changes in production economics.
Red Phosphorus Prices in Europe
Germany Red Phosphorus Price Trends
Germany also recorded an upward market trend during Q2 2026. The Red Phosphorus Price Index rose quarter-over-quarter in Q2 2026, driven by increasing production costs.
The German market's performance was consistent with the broader global trend, where higher manufacturing expenses supported firmer Red Phosphorus pricing.
For producers operating in Germany, changes in industrial production costs can have a direct effect on the economics of supplying Red Phosphorus. When the cost base increases, suppliers may revise market offers accordingly.
The quarter-over-quarter increase in the German Red Phosphorus Price Index reflected this cost-driven market environment.
Impact of Producer Prices in Germany
Red Phosphorus production costs increased, influenced by a 2.2% year-over-year rise in producer prices in May 2026.
The increase in producer prices represented additional cost pressure for industrial manufacturers. Producer-price developments are closely watched because they provide an indication of changes occurring within the manufacturing and supply chain environment.
For Red Phosphorus producers, a higher producer-price environment can increase expenses associated with industrial inputs and production activities. These higher costs can subsequently contribute to upward pressure on selling prices.
Germany's Q2 2026 market therefore demonstrated how changes in broader industrial producer prices can influence the economics of specialty and industrial chemical products.
Book A Demo for Red Phosphorus Price: https://www.chemanalyst.com/ChemAnalyst/PricingForm?Product=Red%20Phosphorus
Key Factors Influencing Red Phosphorus Prices in Q2 2026
Several factors contributed to the upward movement in Red Phosphorus Prices during Q2 2026.
Increasing Production Costs
Increasing production costs were the common factor across China, the United States and Germany. Higher manufacturing expenses reduced the ability of producers to maintain previous price levels without affecting margins.
As a result, rising production costs contributed to quarter-over-quarter increases in the Red Phosphorus Price Index across all three markets.
Producer Price Inflation
Producer-price movements were another important factor. In the United States, the PPI increased 5.5% in June 2026, while Germany recorded a 2.2% year-over-year rise in producer prices in May 2026.
These indicators reflected higher cost pressure within the respective industrial environments and helped support firmer Red Phosphorus market conditions.
Industrial Electricity Costs
The United States experienced additional cost pressure from rising industrial electricity prices as of April 2026. For energy-intensive production, electricity costs can materially affect overall manufacturing expenses.
The rise in U.S. industrial electricity prices therefore reinforced the broader cost pressures affecting Red Phosphorus Prices during Q2 2026.
Example: How Energy Costs Can Affect Red Phosphorus Prices
Consider a Red Phosphorus producer in the United States operating an energy-intensive manufacturing facility. If industrial electricity prices rise, the company's operating expenses increase even if its raw material costs remain unchanged.
The producer may initially absorb part of the increase to remain competitive. However, if higher electricity costs continue, maintaining the same selling price could reduce profit margins. The producer may then adjust its market quotation to reflect the increased cost of production.
If several producers face similar electricity and industrial cost increases, the broader market can experience upward pricing pressure.
This example demonstrates why energy prices and producer-price indicators are important when analyzing Red Phosphorus Prices. The U.S. market during Q2 2026 reflected this type of cost-side influence, with rising industrial electricity prices and a 5.5% PPI increase in June 2026 supporting the firmer market environment.
Impact on Procurement and Supply Chain Planning
The Q2 2026 Red Phosphorus market highlights the importance of monitoring production costs when planning procurement strategies.
Buyers should consider not only current supplier quotations but also the underlying factors influencing those quotations. In China, the USD 5620/MT FOB China quarterly average provides a useful benchmark, while increasing production costs explain the upward movement in the regional price index.
In the United States, procurement teams need to pay close attention to industrial electricity costs and producer-price movements. The combination of rising electricity prices and a 5.5% PPI increase in June 2026 can create continued cost pressure for manufacturers.
In Germany, monitoring producer-price developments remains important because the 2.2% year-over-year rise in producer prices in May 2026 contributed to higher Red Phosphorus production costs.
For companies with regular Red Phosphorus requirements, these indicators can support more informed budgeting, inventory management, contract negotiations and purchasing decisions.
Regional Red Phosphorus Price Comparison
The Q2 2026 market showed a broadly consistent upward trend across the three major regions covered.
China recorded a quarter-over-quarter increase in the Red Phosphorus Price Index, with the average price reaching USD 5620/MT FOB China. Increasing production costs were the primary factor behind the market movement.
The United States also recorded a quarter-over-quarter increase. Here, the pricing environment was influenced by the 5.5% PPI increase in June 2026, together with rising U.S. industrial electricity prices as of April 2026.
Germany recorded another quarter-over-quarter increase in the Red Phosphorus Price Index, driven by increasing production costs and influenced by a 2.2% year-over-year rise in producer prices in May 2026.
The regional comparison demonstrates that production economics remained the common thread connecting the global Red Phosphorus market during Q2 2026.
Red Phosphorus Prices Outlook
The Q2 2026 performance suggests that the Red Phosphorus market entered the second half of 2026 with a firm cost structure.
In China, future Red Phosphorus Prices will depend heavily on the evolution of production costs and overall market supply-demand conditions. Continued cost increases could maintain upward pressure on prices.
In the United States, the direction of industrial electricity prices will remain particularly important. If energy costs continue increasing alongside producer prices, manufacturers could face additional pressure to revise selling offers.
Germany's market will remain sensitive to changes in producer prices and broader industrial production costs. Stabilization in these indicators could support greater price stability, while additional cost increases could sustain upward momentum.
Conclusion
The Red Phosphorus Prices market recorded a firm upward trend across APAC, North America and Europe during Q2 2026.
In China, the Red Phosphorus Price Index rose quarter-over-quarter due to increasing production costs, while the average Red Phosphorus price for the quarter was approximately USD 5620/MT FOB China.
In the United States, the Red Phosphorus Price Index increased quarter-over-quarter, influenced by a 5.5% PPI increase in June 2026. Rising U.S. industrial electricity prices as of April 2026 further increased production costs and contributed to the firm market environment.
Germany also recorded a quarter-over-quarter increase in its Red Phosphorus Price Index, driven by increasing production costs. A 2.2% year-over-year rise in producer prices in May 2026 contributed to higher production expenses.
Overall, Q2 2026 demonstrated the significant role of production economics, producer-price inflation and energy costs in shaping Red Phosphorus Prices. For manufacturers, suppliers, traders and procurement professionals, monitoring these indicators will remain important for understanding market movements and preparing purchasing strategies for the remainder of 2026.
ChemAnalsyt
Call +1 3322586602
420 Lexington Avenue, Suite 300, New York, NY, United States, 10170
Website: https://www.chemanalyst.com/
Email: sales@chemanalyst.com
この記事をシェア